Next: §7 Thesis outline Previous: §5 Bending of jets Contents
HST observations of a sample of 28 3CR radio galaxies with redshifts
![]() in the interval
in the interval
![]() were carried out by
Best et al. (1996) and are described in detail by Best (1996).
The programme had the intention of imaging almost all 3CR radio
galaxies in this redshift interval. These 3CR radio galaxies
were observed in wavebands corresponding to rest-frame U and B.
Additionally, all images were mapped at
were carried out by
Best et al. (1996) and are described in detail by Best (1996).
The programme had the intention of imaging almost all 3CR radio
galaxies in this redshift interval. These 3CR radio galaxies
were observed in wavebands corresponding to rest-frame U and B.
Additionally, all images were mapped at
![]() using the VLA, with a resolution of
using the VLA, with a resolution of
![]() .
These galaxies were also observed at
.
These galaxies were also observed at
![]() with the IRCAM3 of the UKIRT at a resolution of
with the IRCAM3 of the UKIRT at a resolution of
![]() . From these set of observations, Best (1996) produced
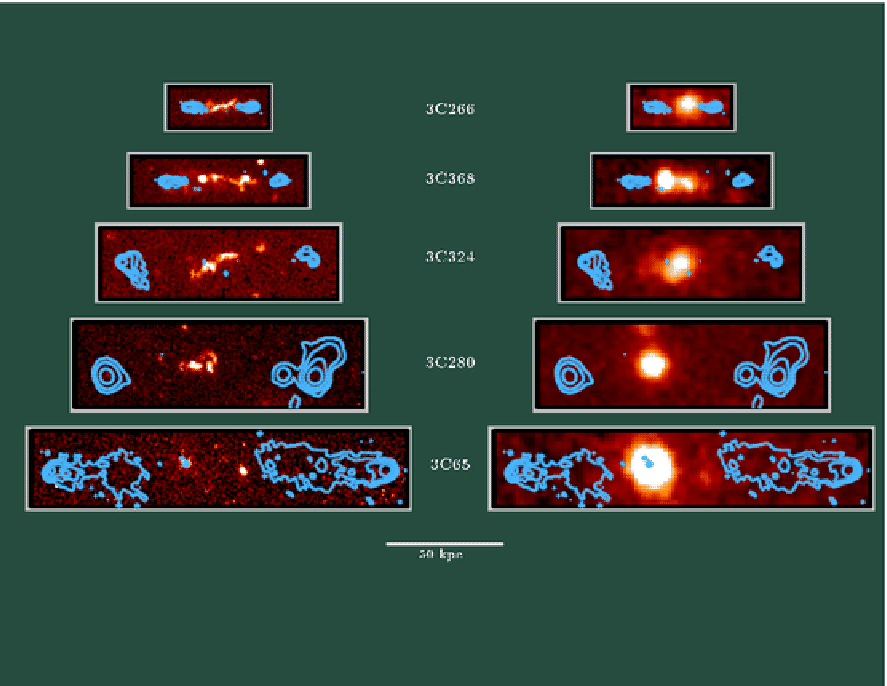
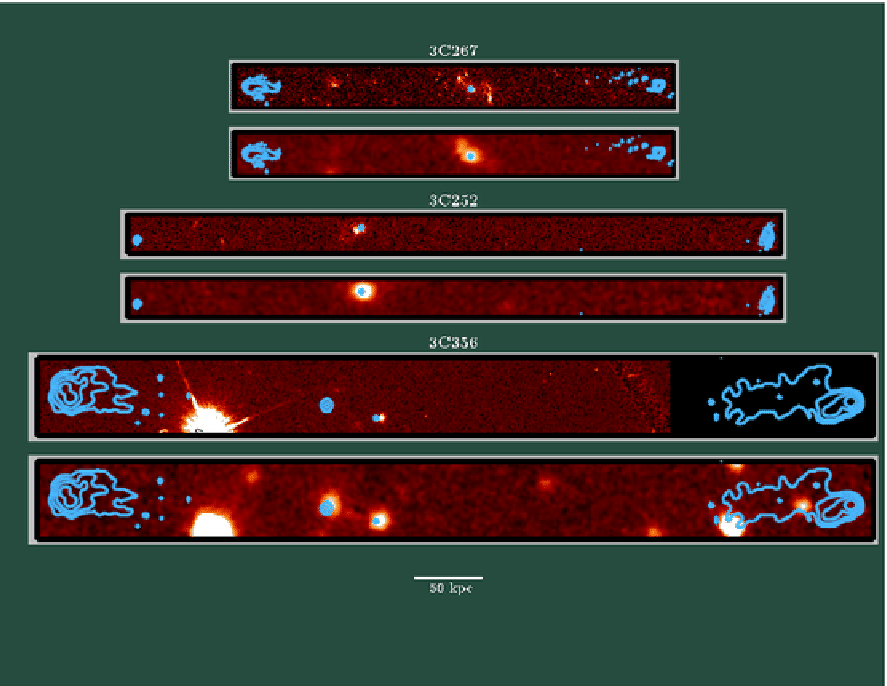
figs.(I.7)-(I.8). The figures show eight 3CR radio
galaxies in the interval
. From these set of observations, Best (1996) produced
figs.(I.7)-(I.8). The figures show eight 3CR radio
galaxies in the interval
![]() . The reason as to why this
redshift interval was chosen is because within it, all radio galaxies have
more or less the same intrinsic radio luminosity. Before analysing in
more detail those images, it is important to note that, in general terms,
a standard
. The reason as to why this
redshift interval was chosen is because within it, all radio galaxies have
more or less the same intrinsic radio luminosity. Before analysing in
more detail those images, it is important to note that, in general terms,
a standard ![]() elliptical galaxy at a redshift
elliptical galaxy at a redshift ![]() is a diffuse low surface brightness object and only objects of high
surface brightness, or flat spectra will appear clearly on the images
in the optical waveband.
is a diffuse low surface brightness object and only objects of high
surface brightness, or flat spectra will appear clearly on the images
in the optical waveband.
The radio images of these galaxies show the standard picture of a classical FR II source. Two radio lobes extend in opposite directions from the central core. The infrared images show the old stellar populations in these galaxies and they indicate that the host galaxy appears to be an elliptical galaxy, as should be expected. However, the optical images show little resemblance to what should be an elliptical host galaxy. Instead, the optical structures observed in the images align to a high degree with the radio jet axis. This effect, the so called radio/optical alignment effect in radio galaxies was first observed by McCarthy et al. (1987); Chambers et al. (1987).
|
|
Synchrotron aging arguments have suggested that the greater the
separation of the radio source from the nucleus, the older the
sources are. This is consistent with a picture in which the sources
are powered by a roughly constant energy supply throughout their
lifetime. Also, according to the unification scenarios mentioned
in section §3, the radio axes of radio galaxies are
observed within
![]() to the plane of the sky.
This implies that the difference between the observed and actual hotspot
separations would not be very big and also that the observed structures
should lie more or less in the plane of the sky.
to the plane of the sky.
This implies that the difference between the observed and actual hotspot
separations would not be very big and also that the observed structures
should lie more or less in the plane of the sky.
As it is seen from the optical images, the oldest radio galaxies do
not show a very strong optical structure aligned with the radio jet axis.
However, the small, young radio galaxies show a very pronounced effect.
This means that the radio/optical alignment effect is relatively short
lived. In fact, Best (1996) calculated the ages of the radio galaxies
using synchrotron aging arguments and concluded that the activity is
completed in about
![]() .
.
All these observations suggest that the aligned optical structures are a short lived phenomena, which is induced by the passage of the radio jet as it expands through the interstellar and intergalactic medium. It seems that, among all the different models that have been proposed in the literature (see Best, 1996, and references therein for a complete description of the different models), there is no single theory that can account for all of the observed features of the alignment between the optical and radio emission (Longair et al., 1995). The observation of polarised optical emission from some of these sources suggests that scattering of light from an obscured quasar could be responsible for these optical structures. A centrally obscured quasar would be responsible to the illumination of pre-existing dust and gas clouds. However, it seems extremely natural that the primary cause must be the interaction of the jet with cool interstellar clouds surrounding the parent galaxy as well as in the intergalactic medium.
McCarthy, van Breugel & Spinrad, and Chambers, Miley & van Breugel proposed that
the alignment of the observed optical structures were produced because
of enhanced star formation induced in some way by the passage of the
radio jet through the interstellar medium of the host galaxy and the
intergalactic medium. According to this jet-induced star
formation picture it would be possible to account for the change
in structure with increasing physical size of the radio galaxies.
The lifetime of the newly formed stars associated with HII regions would
amount to
![]() . After this time
the luminosities of these star-forming regions decay. The polarisation
of the light would then be attributed to the scattering of the light by
the dust or gas associated with the star-forming regions.
. After this time
the luminosities of these star-forming regions decay. The polarisation
of the light would then be attributed to the scattering of the light by
the dust or gas associated with the star-forming regions.
In an attempt to understand better this jet-induced star formation
phenomenon, de Young (1989) performed numerical simulations of
high-energy radio jets passing through dense protogalactic gas.
He showed that cooling in the regions behind the shocks associated with
radio jets can lead to star formation rates over
![]() , when the total mass of gas surrounding
the galaxies approaches
, when the total mass of gas surrounding
the galaxies approaches
![]() .
.
Rees (1988) made a more physical proposal about this star-formation
idea. He built a model for which the interstellar and intergalactic
medium which contained cold (
![]() ) clouds in pressure balance with a hot (
) clouds in pressure balance with a hot (
![]() ) medium. These cold clouds are most probably the result
of cooling flows (Fabian, 2000). The expansion of the shocks associated
with the radio jet expel the hot phase plasma, but leave the clouds within
the lobes, where they are squeezed by the higher pressure around them.
This compression drives the stable clouds into a gravitational unstable
phase, triggering a burst of star formation. After the shock has passed,
the clouds find themselves overpressured by a factor of
) medium. These cold clouds are most probably the result
of cooling flows (Fabian, 2000). The expansion of the shocks associated
with the radio jet expel the hot phase plasma, but leave the clouds within
the lobes, where they are squeezed by the higher pressure around them.
This compression drives the stable clouds into a gravitational unstable
phase, triggering a burst of star formation. After the shock has passed,
the clouds find themselves overpressured by a factor of ![]() , where
, where ![]() is the Mach number of the flow. The value of
is the Mach number of the flow. The value of ![]() is assumed to be
is assumed to be ![]() along the jet and
along the jet and ![]() for the transverse expansion of the cocoon. Since the Jeans Mass
for the transverse expansion of the cocoon. Since the Jeans Mass
![]() (Kron et al., 1995), where
(Kron et al., 1995), where ![]() is the pressure and
is the pressure and ![]() is the
density, the above considerations imply that the resultant overpressure
over the clouds would trigger collapse of all clouds down to a fraction
of any value that lies in the interval
is the
density, the above considerations imply that the resultant overpressure
over the clouds would trigger collapse of all clouds down to a fraction
of any value that lies in the interval
![]() -
-![]() of the
previous Jeans Mass. This results in a very well synchronised burst of
star formation enhanced by a factor of the order of the Mach number.
of the
previous Jeans Mass. This results in a very well synchronised burst of
star formation enhanced by a factor of the order of the Mach number.
(1989) used a similar model to that by
Rees, but considered the shock to be radiative.
In this case, the cloud's Jeans mass decreases by a factor
![]() . Clouds which
initially have masses somewhat less than the Jeans mass are driven
gravitationally unstable by the compression.
. Clouds which
initially have masses somewhat less than the Jeans mass are driven
gravitationally unstable by the compression.
Despite the fact that the idea of a jet-induced star formation model
is very attractive to account for all these results, observations do
not seem to favour this (Best et al., 2000). In fact, it was shown by
Best et al. (2000), that for small radio sources (
![]() ), the morphology, kinematics and ionisation properties of
the emission line gas of the radio sources are dominated by the effects of
the bow shock associated with the expansion of the radio source through
the interstellar and intergalactic medium. Gas clouds embedded in the
interstellar and intergalactic medium are accelerated by the shocks,
giving rise to the distorted velocity profiles and extreme velocity
dispersions observed. On the other hand, large radio sources have more
settled kinematical properties. The shock fronts have passed well beyond
the emission line regions and the dominant source of ionising photons
appears to be the AGN. The diagram shown in fig.(I.9) by
Best et al. (2000) shows the evidence for these different means of explaining
the optical aligned structures.
In Chapter V an analytic one dimensional
model of the interaction of a shock wave with a high density region
(a cloud) is developed. This one dimensional analysis provides an
insight into the more physical mechanisms that might be acting on the
interaction of the jet as it expands and interacts with surrounding
clouds in pressure balance with the interstellar and intergalactic medium.
), the morphology, kinematics and ionisation properties of
the emission line gas of the radio sources are dominated by the effects of
the bow shock associated with the expansion of the radio source through
the interstellar and intergalactic medium. Gas clouds embedded in the
interstellar and intergalactic medium are accelerated by the shocks,
giving rise to the distorted velocity profiles and extreme velocity
dispersions observed. On the other hand, large radio sources have more
settled kinematical properties. The shock fronts have passed well beyond
the emission line regions and the dominant source of ionising photons
appears to be the AGN. The diagram shown in fig.(I.9) by
Best et al. (2000) shows the evidence for these different means of explaining
the optical aligned structures.
In Chapter V an analytic one dimensional
model of the interaction of a shock wave with a high density region
(a cloud) is developed. This one dimensional analysis provides an
insight into the more physical mechanisms that might be acting on the
interaction of the jet as it expands and interacts with surrounding
clouds in pressure balance with the interstellar and intergalactic medium.
Sergio Mendoza Fri Apr 20, 2001